Hello CI enthusiasts! This is our sixth in a series of interviews with experienced backbone leaders. In this chat, we’ll hear from Lynda Petersen, Associate Director at the Community Center for Education Results (CCER).
Founded in 2010, CCER is the backbone for the Road Map Project (RMP), a large collective impact initiative in South King County and South Seattle (Washington) aimed at improving education to drive dramatic improvement in student achievement from cradle to college and career. In 2013 FSG wrote this short case study on the RMP’s origins, structure, and results. Additionally, CCER’s Executive Director, Mary Jean Ryan, wrote an excellent piece in the Stanford Social Innovation Review on Power Dynamics in Collective Impact. We at FSG have long-admired the RMP for the way in which they use data to highlight not only what works, but also where opportunity gaps exist.
I recently spoke with Lynda to check in on the RMP’s progress. If you have questions for Lynda, please pose them in the comment box below, and she will do her best to respond. Thanks, and enjoy!
Highlights from my conversation with Lynda
- Like many other collective impact leaders we speak with, Lynda celebrates successes, but always reminds us that there is much more to do. Collective impact leaders are always balancing wins with a drive to improve.
- The Road Map Project is remarkably transparent with their data. For example, they publish side-by-side data comparing each of the seven school districts in their region. They also publish data disaggregated by race. This keeps the focus on reducing opportunity gaps. See the Road Map Project’s annual reports for how they display data.
- CCER faces challenges when supporting working group members and partners during the implementation phase, including the voices of parents and youth, and using data to change practice.
- Like many other collective impact initiatives, the Road Map Project strives to translate data into concrete actions that close gaps. According to Lynda, “If all we’re doing is ‘problem gazing’ at the data, what impact are we having?”
- To respect parents’ time, Lynda believes they should be compensated for participation in meetings. As Lynda notes, “Some people get paid to go to meetings all day, but parents don’t, and we need that perspective at the table.”
- Four years into the work, RMP has seen many system-level changes, such as policy changes (some of which Lynda believes can have a big and rapid impact), signups for a statewide scholarship program, and stronger relationships as a result of people working together.
 Robert: What are you most excited about regarding the Road Map Project’s work?
Lynda: Many things! Four years into this work, in many cases relationships are strong, which has been a result of people working together on very challenging work.
Additionally, our data team is breaking ground all the time and uncovering new insights. We’re gaining access to new sources of data and thinking innovatively about what we measure and track. CCER plays a role in analyzing data and helping others to use the data meaningfully in their work.
Across our country there’s a real focus on racial equity, and this year we’ve had so many conversations about what that looks like in the RMP, how CCER plays a role. We’re far from figuring it out, but I’ve appreciated the courageous conversations that we and many in our communities are having. The challenge is then “what do we do differently to see the change we want to see?”
What are some of the main systems-level changes you’ve seen, and what’s been driving those changes?
We’ve seen many system-level changes, and I’ll speak to a few.
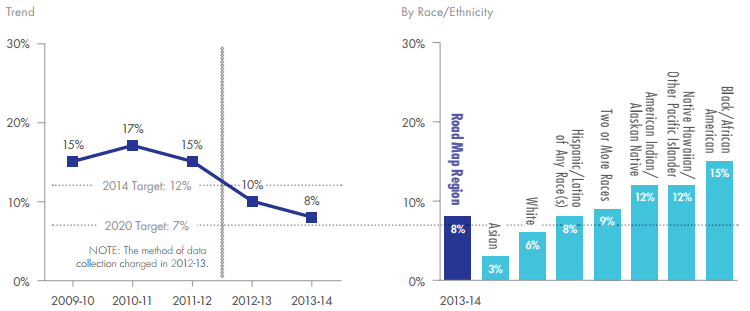
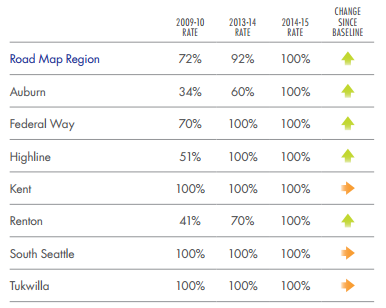
First, there have been policy changes that can then have a really big and rapid impact. For example, we track percentage of students attending full-day Kindergarten. Full-day Kindergarten is a critical access point, and an equity issue. Even before the state of Washington adopted this priority, our districts were already prioritizing funding for this. I can say the same thing about student discipline policies. As a result of increasing public pressure to reassess those policies, we’ve seen districts change policies, which has led to rapidly-improving outcomes. Yet, there is so much more to do!
9th Graders with a Suspension or Expulsion (Source: Road Map Project 2014 Results Report)

Kindergarten Students Attending Full-Day Kindergarten (Source: Road Map Project 2014 Results Report)

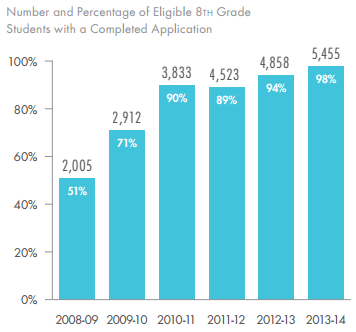
As a region, we’ve also made progress in the signup rate for College Bound scholarships, which significantly helps Washington students cover the costs of college. When the policy establishing the scholarship was passed, there was no system to sign eligible students up for the scholarship, and only about half of them did. So, we worked together on a signup campaign, and have also made some progress in improving the college-going culture in our high schools. There’s certainly a lot more to do, but we are seeing progress in improving college access for low-income students.

Lastly, we’ve been pushing for increases in rigorous course taking and FAFSA filings, which are really important. It has involved a lot of people working from different angles.
What are the main evolutions the Road Map Project has gone through?
Leadership turnover is a big issue. We work across 7 school districts, and none of the superintendents who were there in 2011 (when we started) are still there. In some cases, we’ve been through 3 superintendents in a district. In addition, we’ve seen turnover in the postsecondary space. While in some cases the turnover is a challenge, it can also be an opportunity.
What challenges do you face?
Supporting working group members and partners in implementation is challenging. CCER supports work groups to convene and create an action plan – that’s hard work in and of itself. But, supporting and tracking progress during implementation continues to be a huge challenge. We are working to improve student-level outcomes, but we know that we must be tracking the system-level indicators and adult behavior change that is required to better support all children. For example, to improve 3rd grade reading for ELL children, one system-level indicator that should improve is the number of early elementary teachers certified to teach ELL children.
Can you tell me more about how you embed equity into your activities?
This is a journey for individuals, individual organizations, and the collective. We’ve always had a big focus on closing the opportunity gap for children of color, and we have targets that show us if we’re on or off-track to closing the gaps (see the Road Map Project’s annual reports for how they track progress). But, if all we’re doing is “problem gazing” at the data, what impact are we having? So, we try to tailor strategies to impact those students and families who need it most. For example, we include racial equity in any template when planning strategies or implementation plans.
We are always thinking about the best ways to include the voices of those we most want to support. How do we include the parents and caregivers and youth in a way that’s respectful of them and their time? Some people get paid to go to meetings all day, but low-income parents don’t, and we need that perspective at the table. We will continue to work on this and we have a lot of great organizations that work with parents, and we work with those organizations. We’re all figuring it out together.
Do you have any reflections on challenges and successes with community engagement?
We’ve tried many different things. We have a group of small, grassroots CBOs playing a leadership role on equity, specifically racial equity. But, there’s so much more we could do. We’ve done community results roundtables with different groups where we bring data and work with organizers to have those conversations. That’s been successful to some extent, but in a region as large and diverse as this, we always need to do more.
What tips do you have for other communities for how to make collective impact effective?
I think data remains the way to bring people to common ground in a meeting – it can be very powerful. But who you’re bringing to the table and how the data is framed is very important. And we must all hold the tension of addressing the short-term improvements for children and youth today and the long-term cultural shifts and system-change we need to achieve our goal.
What do you think? Share your questions and comments below.
